
[Model] Firmware
To create new firmware, explore the Create Machine Firmware section
By selecting the firmware section, we can view all versions released for that machine model.
If our user has been enabled to Manage Firmwares, we can mark one of the versions as Main, to indicate the main one and apply one of the available versions if any.
All parameters contained in the Firmware section can be inherited from later versions by importing the .csv file of the previously exported firmware.

If we are enabled to manage firmwares, then we can go into detail and view the following sections:
-
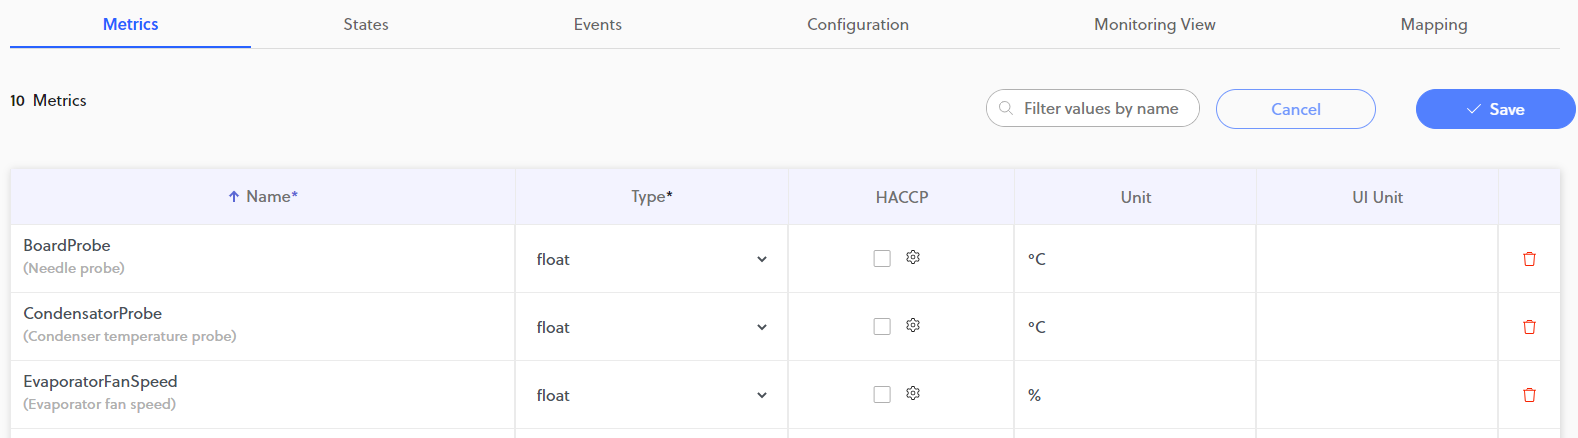
Here we can add metric values, with the following properties:Metrics- Name *
- Type *
- HACCP (if flagged it is relevant to the report)
- Unit (unit of measurement of the value with which the variable is sent)
- Unit UI (unit of measurement that is displayed on Things5)
We can also filter them by name.
Metrics can be configured at any time and new ones added
-
It shows a set of variables that are sent as state, with a start and end value, which they contain:States- Name *
- HACCP (if flagged it is relevant to the report)
We can also filter them by name.
-
Shows a set of variables that are sent as state, with a start and end value, which contain:Events- Name *
- HACCP (if flagged it is relevant to the report)
- Severity
We can also filter them by name.
-
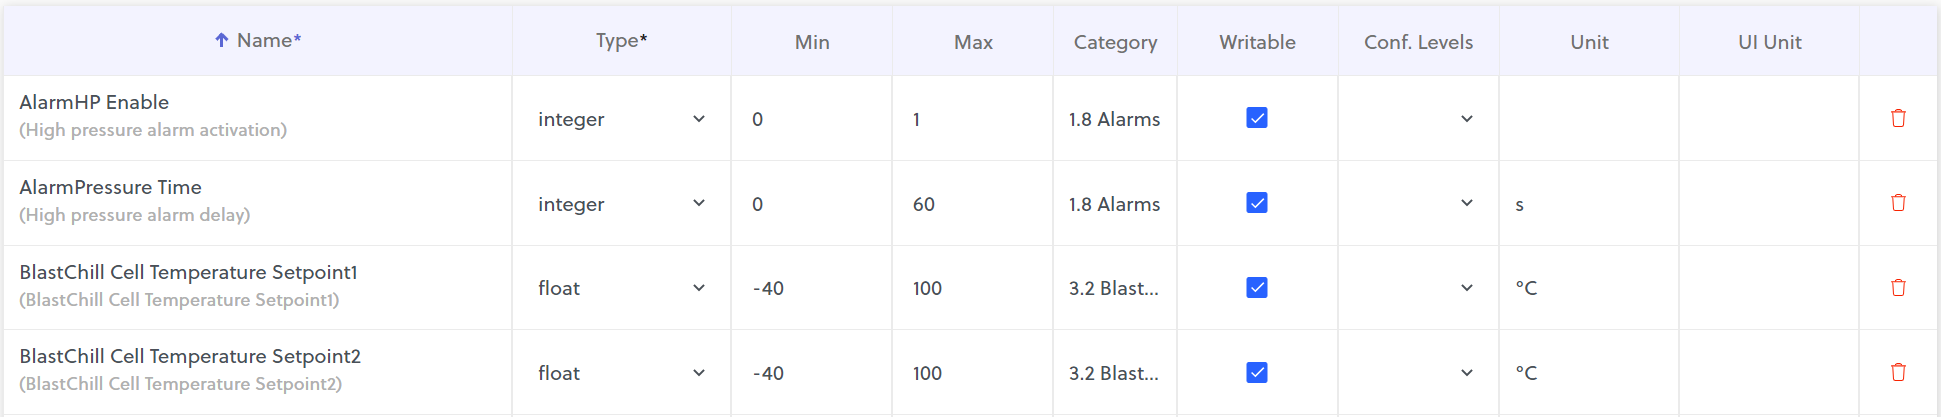
Configuration
Here we can add configuration values, with the following properties:
- Name *
- Type *
- Min
- Max
- Category
- Writable
- Conf. Levels
- Unit
- UI Unit
We can also filter them by name.
The parameters configured in this section (Model>Machine Models>Firmware>Configuration) will be visible in the same section of Machine Detail of the device.
-
Here we can add and sort the Widget and Trend analysis visible by default i the device Monitoring view.Monitoring View
we can add configuration values, with the following properties:- Commands
- Widgets
- Trend analysis
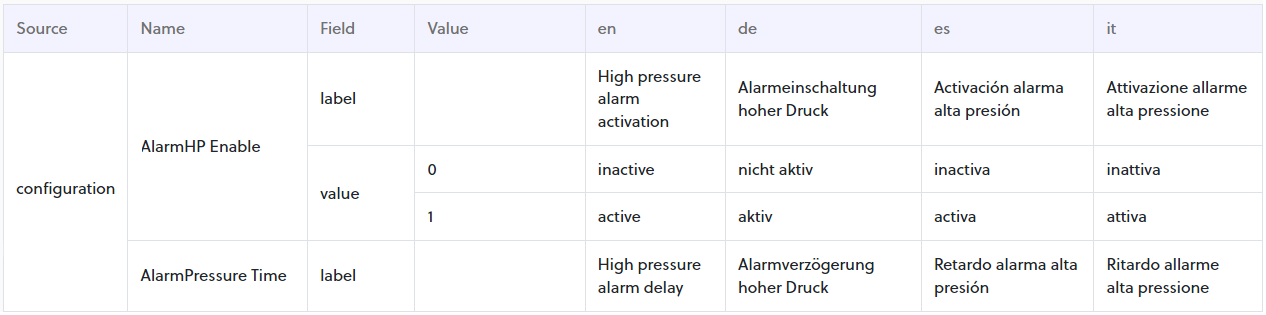
Translations
There is also a Translations button where you can upload metrics via a .csv file with metric translations.
example of the Configuration tab
For MQTT Diagnostic click on the dedicated section
Monitoring View
This section is used to configure the default monitoring dashboard, so if a user were to log into the Things5 platform or a machine using that firmware, they would see the sections configured here, which are divided into:
- Commands
- Widgets
- Trend Analysis
These commands are customized by referencing the variables added in the Configuration section.
Mapping
Here certain KPIs are linked to states.
For example, for energy calculation of a given state, the state of our interest is selected and multiplied by a coefficient by entering the value that will be considered to make the calculation. (e.g. On or Off)
in-depth section in the paragraph Consumptions and Uptime KPIs
In the video below is explained how to insert variables and their translations.
Updated 11 months ago