
Diagnostic
It is possible to configure the diagnostics dashboard in a customized way to delve into the status of certain machines for quick analysis.
You can create any number of Dashboards you need.
Create a Dashboard
- To create just click on the Add Dashboard button.
- You will need to enter the name that will identify it
- Now you will need to select one of the machines in the device list
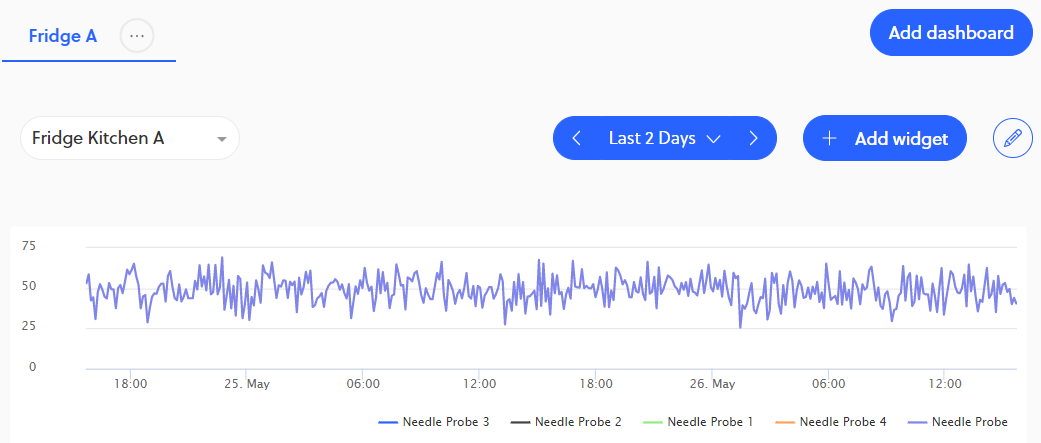
- At this point we can create our widget by clicking on + Add widget
- We will then enter a title, which will refer to the sensor we are interested in,
And then to the type of metric we are interested in analyzing:- Machine Metrics
- Machine States
- Machine Events
- At this point we can choose one or more of the available sensors and save
The list of sensors can be configured from the Firmware/Metrics section, depending on the version applied.
We can then create multiple Dashboards that will create a kind of sheets like in Excel, and each of these can host multiple Widgets that will be customizable like the vertical sorting.
Section visible and manageable by all, changes are user bound
Updated almost 2 years ago